Articles
- Page Path
- HOME > J Trauma Inj > Volume 34(1); 2021 > Article
-
Original Article
The Influence of Seasons and Weather on the Volume of Trauma Patients: 4 Years of Experience at a Single Regional Trauma Center - Se Heon Kim, M.D.1, Young Hoon Sul, M.D., Ph.D.1,2, Jin Young Lee, M.D.1, Joong Suck Kim, M.D.3
-
Journal of Trauma and Injury 2021;34(1):21-30.
DOI: https://doi.org/10.20408/jti.2020.0027
Published online: March 23, 2021
- 3,404 Views
- 95 Download
- 2 Crossref
1Department of Trauma Surgery, Chungbuk National University Hospital, Cheongju, Korea
2Department of Trauma Surgery, College of Medicine, Chungbuk National University, Cheongju, Korea
3Departmenf of Trauma Surgery, Cheju Halla General Hospital, Jeju, Korea
- Correspondence to Young Hoon Sul, M.D., Ph.D. Department of Trauma Surgery, Chungbuk National University Hospital, 776 1 Sunhwan-ro, Seowon-gu, Cheongju 28644, Korea Tel: +82-43-269-7847 Fax: +82-43-269-7810 E-mail: ssulyh@gmail.com
• Received: July 20, 2020 • Revised: October 26, 2020 • Accepted: November 4, 2020
Copyright © 2021 The Korean Society of Traumatology
This is an Open Access article distributed under the terms of the Creative Commons Attribution Non-Commercial License (http://creativecommons.org/licenses/by-nc/4.0/) which permits unrestricted non-commercial use, distribution, and reproduction in any medium, provided the original work is properly cited.
ABSTRACT
-
Purpose
- The purpose of this study was to determine the influence of seasons and weather on the volume of trauma patients in central Korea.
-
Methods
- The records of 4,665 patients treated at Chungbuk National Hospital Regional Trauma Center from January 2016 to December 2019 were retrospectively reviewed. Meteorological data including hourly temperature (°C), precipitation (mm), humidity (%), and wind speed (m/s) for each district were collected retrospectively. Statistical analysis was done using the independent <i>t</i>-test, one-way analysis of variance (ANOVA), and linear regression analysis.
-
Results
- Patients’ average age was 53.66 years, with a significant difference between men (49.92 years) and women (60.48 years) (p<0.001). Rolling/slipping down was a prominent cause of injury in winter (28.4%, n=283), with statistical significance (p<0.001). Trauma occurred least frequently in winter (p=0.005). Linear regression analysis revealed an increasing number of patients as the temperature increased (p<0.05), the humidity increased (p<0.001), and the wind speed decreased (p<0.001). Precipitation did not affect patient volume (p=0.562). One-way ANOVA revealed a decreased incidence of trauma when the temperature exceeded 30°C (p<0.001), and when the humidity was more than 75%, compared to 25–50% and 50–75%.
-
Conclusions
- At the regional trauma center of Chungbuk National University Hospital, in central Korea, the number of trauma patients was lowest in winter, and patient volume was affected by temperature, humidity, and wind speed.
- Trauma is the third most common cause of death for all ages, and the most common cause of death in people younger than 46 years [1]. According to the World Health Organization, motor vehicle accidents (MVAs) ranked as the ninth most common cause of death in 2012, but are expected to become the seventh most common cause of death by 2030. Furthermore, MVAs were found to account for 24% of all trauma deaths, followed by suicide (16%), and falls (14%) [2]. Thus, trauma is one of the most important global health issues due to its depleting effect on medical personnel and resources, as well as its considerable social costs. A prior study reported that the medical costs associated with trauma were about 73 billion dollars in the US, while absence from work due to trauma led to losses of about 419 billion dollars [3].
- Local community-based injury prevention programs have been reported to reduce these expenditures, along with mortality and morbidity from trauma [4]; however, the first step is to investigate and analyze the risk factors of trauma. Furthermore, it has been reported that analyzing and managing situations where trauma occurs led to reductions in trauma-related mortality [3]. Several studies have pointed out seasonal factors and weather as risk factors for the occurrence of trauma [5-7]. For example, Bhattacharyya and Millham [7] reported that the highest temperature and precipitation during the day were independent risk factors for trauma admissions.
- Korea has four distinct seasons and distinct seasonal variations of temperature and humidity, and these factors may therefore have prominent effects on trauma. Furthermore, the recent establishment of regional trauma centers has enabled the construction of a more suitable trauma system based on local communities. However, only a few studies have been conducted regarding environmental effects on trauma occurrence. The purpose of this study was to determine the influence of seasons and weather on the volume of trauma patients who visited Chungbuk National Hospital Regional Trauma Center from 2016 to 2019 in central Korea.
INTRODUCTION
- Patients and data collection
- This study was approved by the Institutional Review Board of Chungbuk National University Hospital (IRB No. 2020-01-014). The data of patients who were treated at Chungbuk National Hospital Regional Trauma Center from January 2016 to December 2019 were retrieved from the Korean Trauma Data Bank and studied. Patients’ medical records, including clinical information and time and location of trauma, were collected. After excluding patients with missing data on the exact time or location of trauma, 4,665 patients were enrolled in this study. The location of trauma was classified into 18 regions (Cheongju, Jincheon, Jeungpyeong, Jecheon, Eumseong, Okcheon, Yeongdong, Boeun, Danyang, Goesan, Chungju, Gongju, Nonsan, Dangjin, Buyeo, Cheonan, Sejong, Daejeon). Meteorological data including hourly temperature (°C), precipitation (mm), humidity (%), and wind speed (m/s) for each district were collected retrospectively.
- Definitions
- Regarding the mechanism of accidents, traffic accidents were classified into pedestrians, drivers, passengers, motorcycle accidents, and bicycle accidents. Rolling/slipping down was defined as falling from a height lower than 2 meters, while falling down was defined as falling down from a height greater than 2 meters. The four seasons included spring (from March to May), summer (from June to August), autumn (from September to November), and winter (from December to February). Weather data were rounded up by 30 minutes based on the accident time to match the weather data at the time that the accident occurred.
- Statistical analysis
- Statistical analysis was carried out for age, temperature (°C), precipitation (mm), humidity (%), and wind speed (m/s) at the time of the accident using the independent t-test. Patients’ age, temperature, humidity, wind speed, and rainfall depending on the season were compared using one-way analysis of variance (ANOVA). Chi-square cross-analysis was used to analyze accident mechanisms, sex, accident time, and day of the week. The monthly average number of patients was compared using one-way ANOVA to determine whether the volume of trauma patients varied according to season, accident time, and day of the week. Linear regression analysis was performed to analyze the correlations of temperature, humidity, wind speed, and hourly rainfall with the volume of trauma patients.
- One-way ANOVA was carried out to compare the annual average number of patients for temperature ranges divided into 10°C intervals, as well as to analyze differences in the volume of trauma patients depending on humidity and wind speed. For all one-way ANOVA, post hoc analysis was performed when analyzing differences according to each variable. All statistical analyses were considered to have significance if the two-tailed p-value was less than 0.05. SPSS version 23.0 (IBM Corp., Armonk, NY, USA) was used for the statistical analysis.
METHODS
- The total number of patients was 4,665, including 3,013 men (64.6%) and 1,652 women (35.4%). Their average age was 53.66±22.64 years (mean±standard deviation), with a significant difference between men (49.92±21.36 years) and women (60.48±23.31 years) (p<0.001). Rolling/slipping down was the most common injury mechanism, with 1,085 patients (23.3%), followed by falling down (n=881; 18.9%). As this trauma center is located in Cheongju, North Chungcheong Province, the majority of patients (n=3,352; 71.7%) were injured in Cheongju, while 515 patients (11.0%) were in Sejong, which is adjacent to Cheongju, and 209 in Boeun (4.5%), 189 in Eumseong (4.0%), and 119 in Jeungpyeong (2.5%).
- As shown in Table 1, there were 1,249 patients in spring, 1,205 in summer, 1,214 in autumn, and 997 in winter. The average age varied depending on the season. The Bonferroni post hoc analysis showed that the average age of trauma patients in spring (51.01±23.16 years) was significantly lower than that of patients treated in autumn (54.68±22.68 years) or winter (54.89±21.59 years) (F=4.124, p=0.006). Rolling/slipping down was most common in winter, accounting for 283 patients (28.4%), compared to spring (22.8%, n=285), summer (21.3%, n=257), and fall (21.4%, n=260), with statistical significance (p<0.001). For motorcycle and bicycle traffic accidents, winter showed a lower incidence rate than other seasons (p<0.001). The average number of patients treated in 1 month for each of the four seasons is shown in Fig. 1. Winter had the least number of patients (F=4.834, p=0.005).
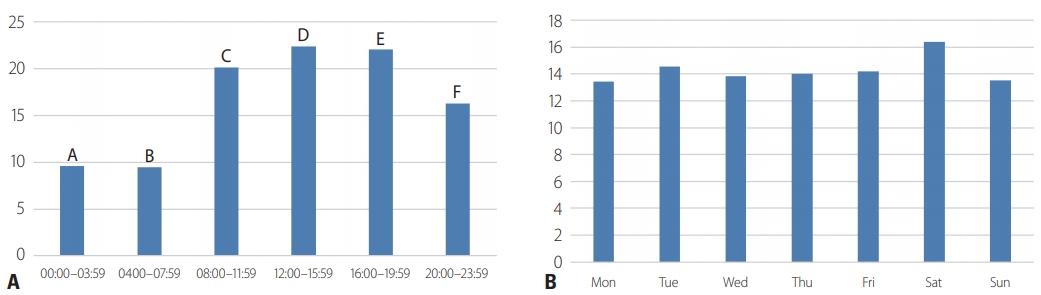
- Table 2 and Fig. 2 show the incidence of trauma divided into 4-hour intervals, with 20.2% of patients experiencing trauma from 08:00 to 12:00, 22.3% from 12:00 to 16:00, and 22.2% from 16:00 to 20:00. This reflected a statistically significant difference (F=52.727, p<0.001). Furthermore, Saturday was the day that accounted for the highest proportion of trauma patients (16.4%) (F=9.398, p<0.001). However, there was no statistically significant difference in the time of trauma occurrence or the day of the week according to the season.
- The average temperature, humidity, wind speed, and precipitation all showed statistically significant differences according to the season (Table 2). The temperature was 26.32°C in summer, 15.27°C in spring, 16.01°C in autumn, and 0.19°C in winter, which was lower than that of the other seasons (Dunnett T3 post hoc analysis: summer>spring & autumn>winter, p<0.001). Humidity was 63.5% and 63.0% in summer and autumn, respectively, which were higher than in the other seasons. Spring (48.34%) had a lower average humidity than winter (55.25%), with a statistically significant difference (Dunnett T3 post hoc analysis: summer & autumn>winter>spring, p<0.001). Wind speed was highest in spring (2.00 m/s), followed by 1.79m/s in summer and 1.57 m/s in winter and 1.52 m/s in autumn; the latter two seasons showed similar results (Dunnett T3 post-hoc analysis: spring>summer>autumn & winter, p<0.001). Precipitation was lowest in winter (Dunnett T3 post-hoc analysis: summer & autumn>winter, p=0.001).
- In order to verify the effect of the weather on the volume of trauma patients, a linear regression analysis was performed for temperature, humidity, wind speed, and hourly rainfall (Table 3). As the temperature increased, the number of patients increased, showing a positive relationship (β=0.261, p<0.05, F=7.321, R2=0.261, Fig. 3A). Increasing humidity also showed a positive relationship with the number of patients (β=0.450, p<0.001, F=24.924, R2=0.203) (Fig. 4A). In contrast, a negative relationship was found between wind speed and the number of trauma patients (β=-0.839, p<0.001, F=166.057, R2=0.703) (Fig. 5A). No significant relationship was found between hourly rainfall and the volume of trauma patients (β=-0.073, p=0.562, F=0.341, R2=0.005). However, when it rained, there were 18.1 patients per month, versus 365 patients per month when it did not rain. Thus, the authors carried out a linear regression analysis on hourly rainfall with the exclusion of non-rainy days, but did not find a statistically significant association (β=-0.104, p=0.066, F=3.509, R2=0.053) (Fig. 6).
- Fig. 3B shows the average annual number of patients according to 10°C temperature intervals. The number of patients was highest in the 20–30°C range, and as the temperature decreased, the number of patients decreased. Above 30°C, the number of patients sharply decreased (Bonferroni post hoc analysis, p<0.001). When the humidity was divided into 25% ranges and used to analyze the monthly average number of patients, a higher incidence was found in the 25–50% (group B) and 50–75% (group C) humidity ranges than in the humidity range of >75% (group D), while the lowest incidence was found when the humidity was less than 25% (group A) (Bonferroni post-hoc analysis: group B, C>group D>group A, p<0.001) (Fig. 4B). The wind speed was divided by 1 m/s intervals into six groups to compare the monthly average number of patients. As shown in Fig. 5B, the largest number of patients was observed at wind speeds of 1 to 2 m/s, with statistical significance.
RESULTS
- Cheongju, where the Chungbuk Regional Trauma Center is located, is in the central region of Korea with a latitude of 36° 24′ 30″ N and a longitude of 127° 16′ 33″ E. It has four distinct seasons with distinct patterns of temperature, humidity, wind speed, and precipitation. Several studies have examined the relationships between seasons and the occurrence of trauma, generally finding relatively few patients in winter and many patients in summer [3,7,8]. A study by Nahmias et al. [3] was conducted in the state of Massachusetts in the USA, located at a latitude of 42° 18′ 0″ N and a longitude of 71° 48′ 0″ W, with distinct temperature zones in winter (-9°C to 1°C), spring (0.5°C to 13°C), and summer (13°C to 26°C), and found that fewer trauma patients occurred in winter than in other seasons. This study similarly showed that the average temperature in winter was lower than in other seasons (by 15°C on average), and the occurrence of trauma was relatively low in winter (Fig. 1). However, there was no statistically significant difference in the average monthly incidence of trauma patients among other seasons.
- Several studies have reported that temperature, sunny weather, and the length of the day affected the number of trauma patients [7,9-11]. A lower number of trauma patients may be caused by unsuitable conditions for outside activities. Wilson et al. [8] that reported hip fractures in the elderly increased due to slipping down injuries in the winter, while traumatic fractures in children became more common due to increased outside activity in summer. This study showed that motorcycle accidents and bicycle accidents occurred less frequently in winter than in other seasons, while rolling/slipping down injuries were more common in winter than in other seasons. This is also probably due to differences in outdoor activities depending on the seasons.
- Some studies have reported that fewer patients present to the emergency room due to trauma on days when people do not go outside and instead stay at home, with fewer outside activities, such as holidays [12,13], and it was found that the incidence of trauma at rush hour was five times higher than in the early morning hours [5]. In this study, more than 60% of trauma incidents occurred from 8:00 am to 8:00 pm, which is the time period when people tend to be active regardless of the season. As shown in Fig. 2A, there was a difference in the incidence of trauma patients according to the time of week. Bhattacharyya and Millham [7] reported that more trauma patients occurred on Saturday and Sunday than on weekdays, and more trauma patients were observed on Saturday than on other days in this study (Fig. 2B). Thus, trauma is more likely to occur when outdoor activities are more common, as demonstrated in this study.
- Rising et al. [5] reported that the incidence of trauma increased by 5.25% per hour as the temperature increased by 10°F, and that the increase in temperature had a stronger influence than the seasonal factor. Bhattacharyya and Millham [7] likewise reported that admissions of trauma patients increased as the maximum daily temperature increased. The present study also showed that increased temperatures were correlated with an increased incidence of trauma patients. However, it cannot be concluded that an increase in temperature increases the incidence of trauma because other variables, in addition to temperature itself, influence the occurrence of trauma. In particular, in the analysis of trauma according to 10°C temperature ranges, it was found that trauma increased with temperature below 30°C, but then trauma decreased sharply as temperatures rose above 30°C. This most likely occurred because people are not likely to go outside when it is excessively hot. It is also relevant that relatively few days had temperatures above 30°C.
- As for humidity, Rising et al. [5] reported that accident rates decreased by 1.36% as humidity increased by 10%, but without a statistically significant effect. Bhattacharyya and Millham [7] reported that the total trauma admission rate was reduced by 11% when the maximum humidity was above 90%, but it was not possible to demonstrate an association with the incidence of trauma patients at other humidity ranges. In this study, a positive and statistically significant correlation was found between the volume of trauma patients and increasing humidity, but as shown in Fig. 4B, the average monthly number of patients at a humidity above 75% was lower than that at 25–50% and 50–75%, similar to the findings reported by Bhattacharyya and Millham [7]. Thus, as with the relationship of temperature discussed above, it is likely that the relationship of humidity with trauma is mediated by other factors; for instance, outdoors activities may be less common in the winter, when the humidity is low, or in the summer when the humidity is extremely high.
- Similar findings were found for rainfall. In the present study, the incidence of trauma patients on rainy days was 18.1 people per month, which was statistically significantly lower than the 365 people per month found on non-rainy days (p<0.001), but a correlation between the incidence of trauma patients and the amount of rainfall was not found. However, other studies conducted in Dublin, Boston, Melbourne, and Tokyo reported a decrease in trauma on rainy days [7,9,14]. On the contrary, studies in Louisville reported a positive, Kentucky reported a positive relationship between rainfall and the volume of trauma patients [5,13]. A study conducted in Scotland, similar to this study, found no statistically significant link between rainfall and the occurrence of trauma [15]. Discrepancies in research results among these regions may reflect not only differences in rainfall, but also factors such as snowfall, humidity, and wind speed, and it has been reported that differences in weather characteristics across regions where research was conducted might affect the results [13].
- In this study, the highest proportion of trauma patients occurred at a wind speed of 1–2 m/s. However, many previous studies found no statistically significant correlation between wind speed and trauma incidence [5,8,10,16]. In particular, a study reported in 2018 conducted at the same center as the authors showed a decreased incidence of trauma as the wind speed decreased, but without statistical significance [16]. However, in this study, the wind speed in when most incidents of trauma occurred was 0–3 m/s (light breeze, second grade according to the Beaufort Scale [17-19]); thus, this finding can most likely be explained in terms of an increase in outdoor activities, not wind speed itself.
- This study has several limitations. First, it is a retrospective study affected by selection bias and unreliable data. Second, although the purpose of this study was to identify correlations between the environment and the volume of trauma patients by region, it is difficult to generalize the results due to regional limitations. Although this study was conducted at an institution that provides regional trauma care, it cannot be considered representative of the community because it does not contain data on all trauma patients from the region. Third, the sample size is relatively small, with 4 years of data from a single center. Currently, there are a total of three regional trauma centers in North Chungcheong Province and South Chungcheong Province, which correspond to the central region of Korea. Coordination with these centers will yield more reliable results.
DISCUSSION
- Despite some limitations, this study demonstrated lower trauma incidence in winter at the regional trauma center of Chungbuk National University Hospital, in central Korea, and correlations were found between the incidence of trauma and weather indicators such as temperature, humidity, and wind speed. In particular, although temperature and humidity were positively correlated with the incidence of trauma, some complex relationships were found; for example, the incidence of trauma decreased when the temperature was above 30°C or when the humidity was above 75%. For more meaningful and reliable results in the future, multi-institutional studies and longer periods of research are needed.
CONCLUSION
Fig. 1.Average number of trauma patients per month according to season (one-way ANOVA and Bonferroni post hoc analysis). One-way ANOVA (F=4.834, p=0.005), Bonferroni’s post-hoc analysis: Winter<Spring, Summer, Autumn. ANOVA: analysis of variance.

Fig. 2.Proportion of trauma patients. (A) According to injury time. One-way ANOVA (F=52.727, p<0.001), Bonferroni’s post-hoc analysis: C, D, E>F>A, B. (B) According to the day of the week. One-way ANOVA (F=9.398, p<0.001), Bonferroni’s post-hoc analysis: Sat>Mon, Tue, Wed, Thu, Fri, Sun. ANOVA: analysis of variance.

Fig. 3.Number of trauma patients according to temperature. (A) Patients distribution graph (Linear regression analysis). β=0.261, p<0.05, F=7.321, R2=0.261. (B) Average number of trauma patients per year. One-way ANOVA (F=125.615, p<0.001), Bonferroni’s post-hoc analysis: E>C, D>B>A, F. ANOVA: analysis of variance.
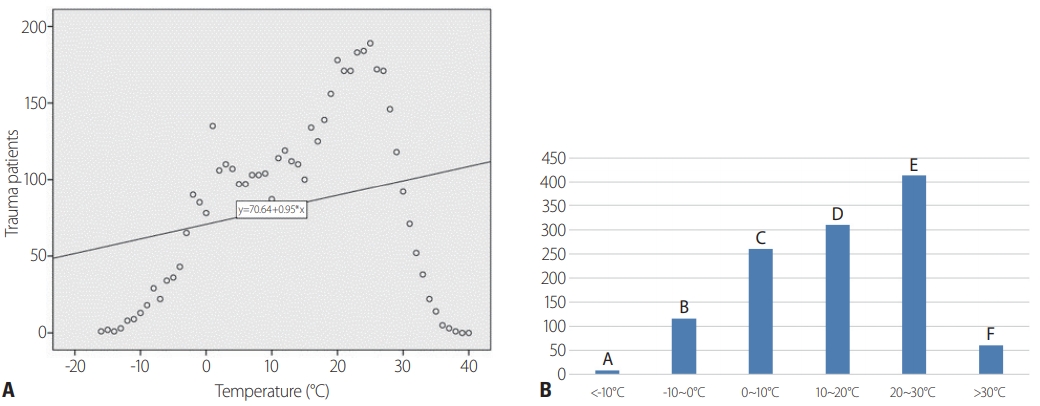
Fig. 4.Number of trauma patients according to humidity. (A) Patients distribution graph (Linear regression analysis). β=0.450, p<0.001, F: 24.924, R2=0.203. (B) Average monthly number of trauma patient. One-way ANOVA (F=26.447, p<0.001), Bonferroni’s post-hoc analysis: B, C>D>A. ANOVA: analysis of variance.
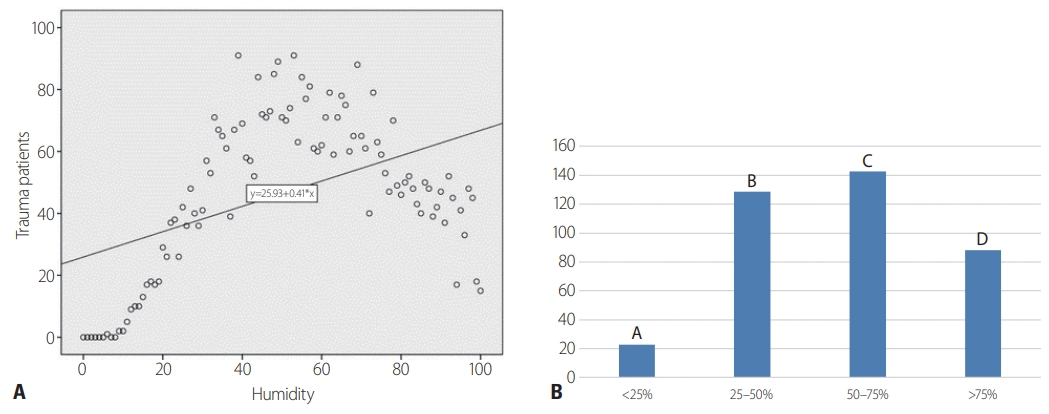
Fig. 5.Number of trauma patients according to wind speed. (A) Patients distribution graph (Linear regression analysis). β=-0.839, p<0.001, F=166.057, R2=0.703. (B) Average monthly number of trauma patient according to wind speed. β=-0.839, p<0.001, F=166.057, R2=0.703.

Fig. 6.Patients distribution graph according to hourly precipitation (only rainy days). β=-0.104, p=0.066, F=3.509, R2=0.053.
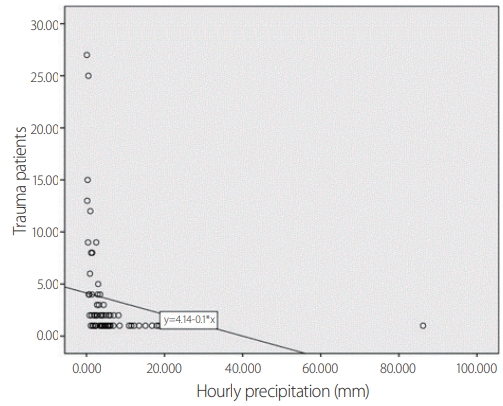
Table 1.Clinical characteristics of patients by season
| Variables | Total (n=4,665) | Spring (n=1,249) | Summer (n=1,205) | Autumn (n=1,214) | Winter (n=997) | p-value | |
|---|---|---|---|---|---|---|---|
| Age (year)a | 53.66 (22.64) | 52.01 (23.16) | 53.32 (22.81) | 54.68 (22.68) | 54.89 (21.59) | 0.006 | |
| Sex | 0.336 | ||||||
| Male | 3,013 (64.6) | 807 (64.6) | 785 (65.1) | 800 (65.9) | 621 (62.3) | ||
| Female | 1,652 (35.4) | 442 (35.4) | 420 (34.9) | 414 (34.1 | 376 (37.7) | ||
| Injury mechanismb | <0.001 | ||||||
| Pedestrian TA | 280 (6.0) | 82 (6.6) | 66 (5.5) | 60 (4.9) | 72 (7.2) | 0.092 | |
| Driver TA | 601 (12.9) | 165 (13.2) | 139 (11.5) | 163 (13.4) | 134 (13.4) | 0.442 | |
| Passenger TA | 152 (3.3) | 35 (2.8) | 49 (4.1) | 33 (2.7) | 35 (3.5) | 0.192 | |
| Motorcycle TAb | 449 (9.6) | 118 (9.4) | 151 (12.5) | 114 (9.4) | 66 (6.6) | <0.001 | |
| Bicycle TAb | 195 (4.2) | 65 (5.2) | 66 (5.5) | 46 (3.8) | 18 (1.8) | <0.001 | |
| Falling down | 881 (18.9) | 231 (18.5) | 216 (17.9) | 259 (21.3) | 175 (17.6) | 0.074 | |
| Rolling/slipping downb | 1,085 (23.3) | 285 (22.8) | 257 (21.3) | 260 (21.4) | 283 (28.4) | <0.001 | |
| Other motor vehicle TAa | 280 (6.0) | 60 (4.8) | 67 (5.6) | 94 (7.7) | 59 (5.9) | 0.008 | |
| Penetrating | 184 (3.9) | 50 (4.0) | 53 (4.4) | 40 (3.3) | 41 (4.1) | 0.540 | |
| Etc. | 558 (12.0) | 158 (12.7) | 141 (11.7) | 145 (11.9) | 114 (11.4) | 0.805 | |
Table 2.Baseline demographics by season
| Variables | Total (n=4,665) | Spring (n=1,249) | Summer (n=1,205) | Autumn (n=1,214) | Winter (n=997) | p-value | |
|---|---|---|---|---|---|---|---|
| Time of trauma | 0.005 | ||||||
| 00:00–03:59 | 449 (9.6) | 113 (9.0) | 121 (10.0) | 111 (9.1) | 104 (10.4) | 0.594 | |
| 04:00–07:59 | 439 (9.4) | 104 (8.3) | 130 (10.8) | 107 (8.8) | 98 (9.8) | 0.164 | |
| 08:00–11:59 | 940 (20.2) | 231 (18.5) | 262 (21.7) | 243 (20.0) | 204 (20.5) | 0.240 | |
| 12:00–15:59 | 1,042 (22.3) | 281 (22.5) | 251 (20.8) | 283 (23.3) | 227 (22.8) | 0.476 | |
| 16:00–19:59a | 1,035 (22.2) | 287 (23.0) | 239 (19.8) | 308 (25.4) | 201 (20.2) | 0.004 | |
| 20:00–23:59a | 760 (16.3) | 233 (18.7) | 202 (16.8) | 162 (13.3) | 163 (16.3) | 0.004 | |
| Week | 0.978 | ||||||
| Monday | 625 (13.4) | 161 (12.9) | 176 (14.6) | 149 (12.3) | 139 (13.9) | ||
| Tuesday | 681 (14.6) | 190 (15.2) | 165 (13.7) | 182 (15.0) | 144 (14.4) | ||
| Wednesday | 645 (13.8) | 174 (13.9) | 168 (13.9) | 170 (14.0) | 133 (13.3) | ||
| Thursday | 657 (14.1) | 176 (14.1) | 170 (14.1) | 176 (14.5) | 135 (13.5) | ||
| Friday | 663 (14.2) | 171 (13.7) | 178 (14.8) | 171 (14.1) | 143 (14.3) | ||
| Saturday | 763 (16.4) | 208 (16.7) | 199 (16.5) | 189 (15.6) | 167 (16.8) | ||
| Sunday | 631 (13.5) | 169 (13.5) | 149 (12.4) | 177 (14.6) | 136 (13.6) | ||
| Climate parameter | |||||||
| Temperature (°C)b | 15.09 (10.84) | 15.27 (7.17) | 26.32 (4.13) | 16.01 (7.27) | 0.19 (5.06) | <0.001 | |
| Humidityb | 57.55 (22.64) | 48.34 (22.58) | 63.50 (18.65) | 63.00 (20.39) | 55.25 (19.37) | <0.001 | |
| Wind speed (m/sec)b | 1.73 (1.13) | 2.00 (1.24) | 1.79 (1.00) | 1.52 (1.08) | 1.57 (1.23) | <0.001 | |
| Hourly precipitation (mm)a | 0.13 | 0.078 | 0.28 | 0.12 | 0.03 | 0.001 | |
Table 3.Linear regression analysis for predicting trauma patients
| Variables | B | S. E. | β | t | p-value |
|---|---|---|---|---|---|
| Temperature (°C)a | 0.949 | 0.474 | 0.261 | 2.003 | <0.05 |
| Humidity (%)b | 0.401 | 0.080 | 0.450 | 4.992 | <0.001 |
| Wind speed (m/sec)b | -25.675 | 1.993 | -0.839 | -12.886 | <0.001 |
| Hourly precipitation (mm) | -3.552 | 6.087 | -0.073 | -0.584 | 0.562 |
| Hourly precipitation with only rainy day (mm) | -0.104 | 0.055 | -0.230 | -1.873 | 0.066 |
- 1. Rhee P, Joseph B, Pandit V, Aziz H, Vercruysse G, Kulvatunyou N, et al. Increasing trauma deaths in the United States. Ann Surg 2014;260:13–21. ArticlePubMed
- 2. World Health Organization (WHO). Injuyry and violence the facts [Internet]. Geneva: WHO; 2014 [cited 2020 Oct 24]. Available from: https://www.who.int/violence_injury_prevention/media/news/2015/Injury_violence_facts_2014/en/.
- 3. Nahmias J, Poola S, Doben A, Garb J, Gross RI. Seasonal variation of trauma in Western Massachusetts: fact or folklore. Trauma Surg Acute Care Open 2017;2:e000120ArticlePubMedPMC
- 4. Bonnie RJ, Fulco CE, Liverman CT. Reducing the burden of injury: advancing prevention and treatment. Washington (DC): The National Academies Press; 1999.
- 5. Rising WR, O’Daniel JA, Roberts CS. Correlating weather and trauma admissions at a level I trauma center. J Trauma 2006;60:1096–100. ArticlePubMed
- 6. Lin LW, Lin HY, Hsu CY, Rau HH, Chen PL. Effect of weather and time on trauma events determined using emergency medical service registry data. Injury 2015;46:1814–20. ArticlePubMed
- 7. Bhattacharyya T, Millham FH. Relationship between weather and seasonal factors and trauma admission volume at a Level I trauma center. J Trauma 2001;51:118–22. ArticlePubMed
- 8. Wilson JM, Staley CA, Boden AL, Boissonneault AR, Schwartz AM, Schenker ML. The effect of season and weather on orthopaedic trauma: consult volume is significantly correlated with daily weather. Adv Orthop 2018;2018:6057357. ArticlePubMedPMCPDF
- 9. Abe T, Tokuda Y, Ohde S, Ishimatsu S, Nakamura T, Birrer RB. The influence of meteorological factors on the occurrence of trauma and motor vehicle collisions in Tokyo. Emerg Med J 2008;25:769–72. ArticlePubMed
- 10. Ho VP, Towe CW, Chan J, Barie PS. How’s the weather? Relationship between weather and trauma admissions at a level I trauma center. World J Surg 2015;39:934–9. ArticlePubMedPDF
- 11. Parsons N, Odumenya M, Edwards A, Lecky F, Pattison G. Modelling the effects of the weather on admissions to UK trauma units: a cross-sectional study. Emerg Med J 2011;28:851–5. ArticlePubMed
- 12. Holleman DR Jr, Bowling RL, Gathy C. Predicting daily visits to a walk-in clinic and emergency department using calendar and weather data. J Gen Intern Med 1996;11:237–9. ArticlePubMedPDF
- 13. Friede KA, Osborne MC, Erickson DJ, Roesler JS, Azam A, Croston JK, et al. Predicting trauma admissions: the effect of weather, weekday, and other variables. Minn Med 2009;92:47–9. PMC
- 14. Masterson E, Borton D, O’Brien T. Victims of our climate. Injury 1993;24:247–8. ArticlePubMed
- 15. Macgregor DM. Effect of weather on attendance with injury at a paediatric emergency department. Emerg Med J 2003;20:204–5. ArticlePubMedPMC
- 16. Kim YM, Yu GG, Shin HJ, Lee SW, Park JS, Kim H. Effect of regional climatic conditions, air pollutants, and season on the occurrence and severity of injury in trauma patients. J Korean Soc Emerg Med 2018;29:603–15.
- 17. Met Office. Beaufort wind force scale [Internet]. Exeter, Devon: Met Office; 2015 [cited 2020 Oct 24]. Available from: https://www.metoffice.gov.uk/weather/guides/coast-and-sea/beaufort-scale.
- 18. Royal Meteorological Society (RMetS). The Beaufort Scale: how is wind speed measured? [Internet]. Oxford Rd: RMetS; 2018 [cited 2020 Oct 24]. Available from: https://www.rmets.org/resource/beaufort-scale.
- 19. Encyclopaedia Britannica. Beaufort scale [Internet]. Edinburgh:Encyclopaedia Britannica 2017;[cited 2020 Oct 24]. Available from: https://www.britannica.com/science/Beaufort-scale.
REFERENCES
Figure & Data
References
Citations
Citations to this article as recorded by 
- Climate change and mental health in Korea: A scoping review
Jiyoung Shin, Juha Baek, Sumi Chae
Journal of Climate Change Research.2023; 14(6-2): 989. CrossRef - The impact of COVID-19 on trauma patients and orthopedic trauma operations at a single focused training center for trauma in Korea
Wonseok Choi, Hanju Kim, Whee Sung Son, Seungyeob Sakong, Jun-Min Cho, Nak-Jun Choi, Tae-Wook Noh, Namryeol Kim, Jae-Woo Cho, Jong-Keon Oh
Journal of Trauma and Injury.2022; 35(3): 195. CrossRef
 PubReader
 ePub Link
 Cite
Cite