Usefulness of Shock Index to Predict Outcomes of Trauma Patient: A Retrospective Cohort Study
Article information
Abstract
Purpose
We investigated how prehospital, emergency room (ER), and delta shock indices (SI) correlate with outcomes including mortality in patients with polytrauma.
Methods
We retrospectively reviewed the medical records of 1,275 patients who visited the emergency department from January 2015 to April 2018. A total of 628 patients were enrolled in the study. Patients were divided into survivor and non-survivor groups, and logistic regression analysis was used to investigate independent risk factors for death. Pearson coefficient analysis and chi-square test were used to examine the significant relationship between SI and clinical progression markers.
Results
Of 628 enrolled patients, 608 survived and 27 died. Multivariate logistic regression analysis reveals “age” (p<0.001; OR, 1.068), “pre-hospital SI >0.9” (p<0.001; OR, 11.629), and “delta SI ≥0.3” (p<0.001; OR, 12.869) as independent risk factors for mortality. Prehospital and ER SIs showed a significant correlation with hospital and intensive care unit length of stay and transfusion amount. Higher prehospital and ER SIs (>0.9) were associated with poor clinical progression.
Conclusions
SI and delta SI are significant predictors of mortality in patients with polytrauma. Moreover, both prehospital and ER SIs can be used as predictive markers of clinical progression in these patients.
INTRODUCTION
Many aspects are important in the management of trauma patients, but the most important aspect is the detection and control of bleeding. Massive bleeding is the most significant determinant of prognosis in patients with trauma and the most common cause of death. In other words, in the so-called golden hour, control of bleeding is the most essential step that can improve the patient’s prognosis and reduce the risk of mortality [1,2].
However, control of bleeding is not a simple approach. Definite external bleeding by trauma can be controlled by on-site compression. However, internal bleeding resulting from internal organ injury and pelvic bone or major proximal bone fracture is often not detected because of various factors, and this causes delays in management [3,4]. When patients with trauma miss the timing of hemorrhagic control, coagulopathy or systemic acidosis may develop. Moreover, this lethal triad leads to death.
Recently, the concept of shock index (SI) has regained attention in the area of polytrauma patient management. SI was first developed by Allgöwer and Burri [5] in 1967: this value is calculated as the heart rate (HR) divided by systolic blood pressure (SBP), and not considered independent of HR or SBP. Generally, SI <0.7 is considered normal, and SI >0.9 is considered abnormal [6–9]. Based on its simplicity and clarity, studies have been conducted on a marker that predicts bleeding in patients with polytrauma and reflects the acute volume loss of hemorrhagic shock [7]. However, few studies have investigated differences in outcomes according to SI at different time points or scale of SI change.
We investigated the correlation between the SI at the pre-hospital trauma scenario and patient outcomes including mortality and between the SI at the inhospital emergency room (ER) and patient outcomes. Moreover, we also investigated the gap between ER and pre-hospital SIs, so-called delta SI, on whether it has a correlation with outcomes in patients with trauma.
METHODS
Patient enrollment and data collection
Records of consecutive patients aged 18 years or older with traumatic injury who were treated between January 2015 and April 2017 in an urban setting in Seoul, South Korea, were retrospectively reviewed. This study was approved by the Institutional Review Board (IRB No. 4-2018-0579), and the requirement for informed consent was waived because of the retrospective nature of the study.
A total of 1,275 trauma patients were admitted to the Emergency Department (ED) during the study period, and 628 patients were enrolled (Fig. 1). These patients were divided into survivor and non-survivor groups within 30 days and investigated the risk factor that caused the patient’s death.
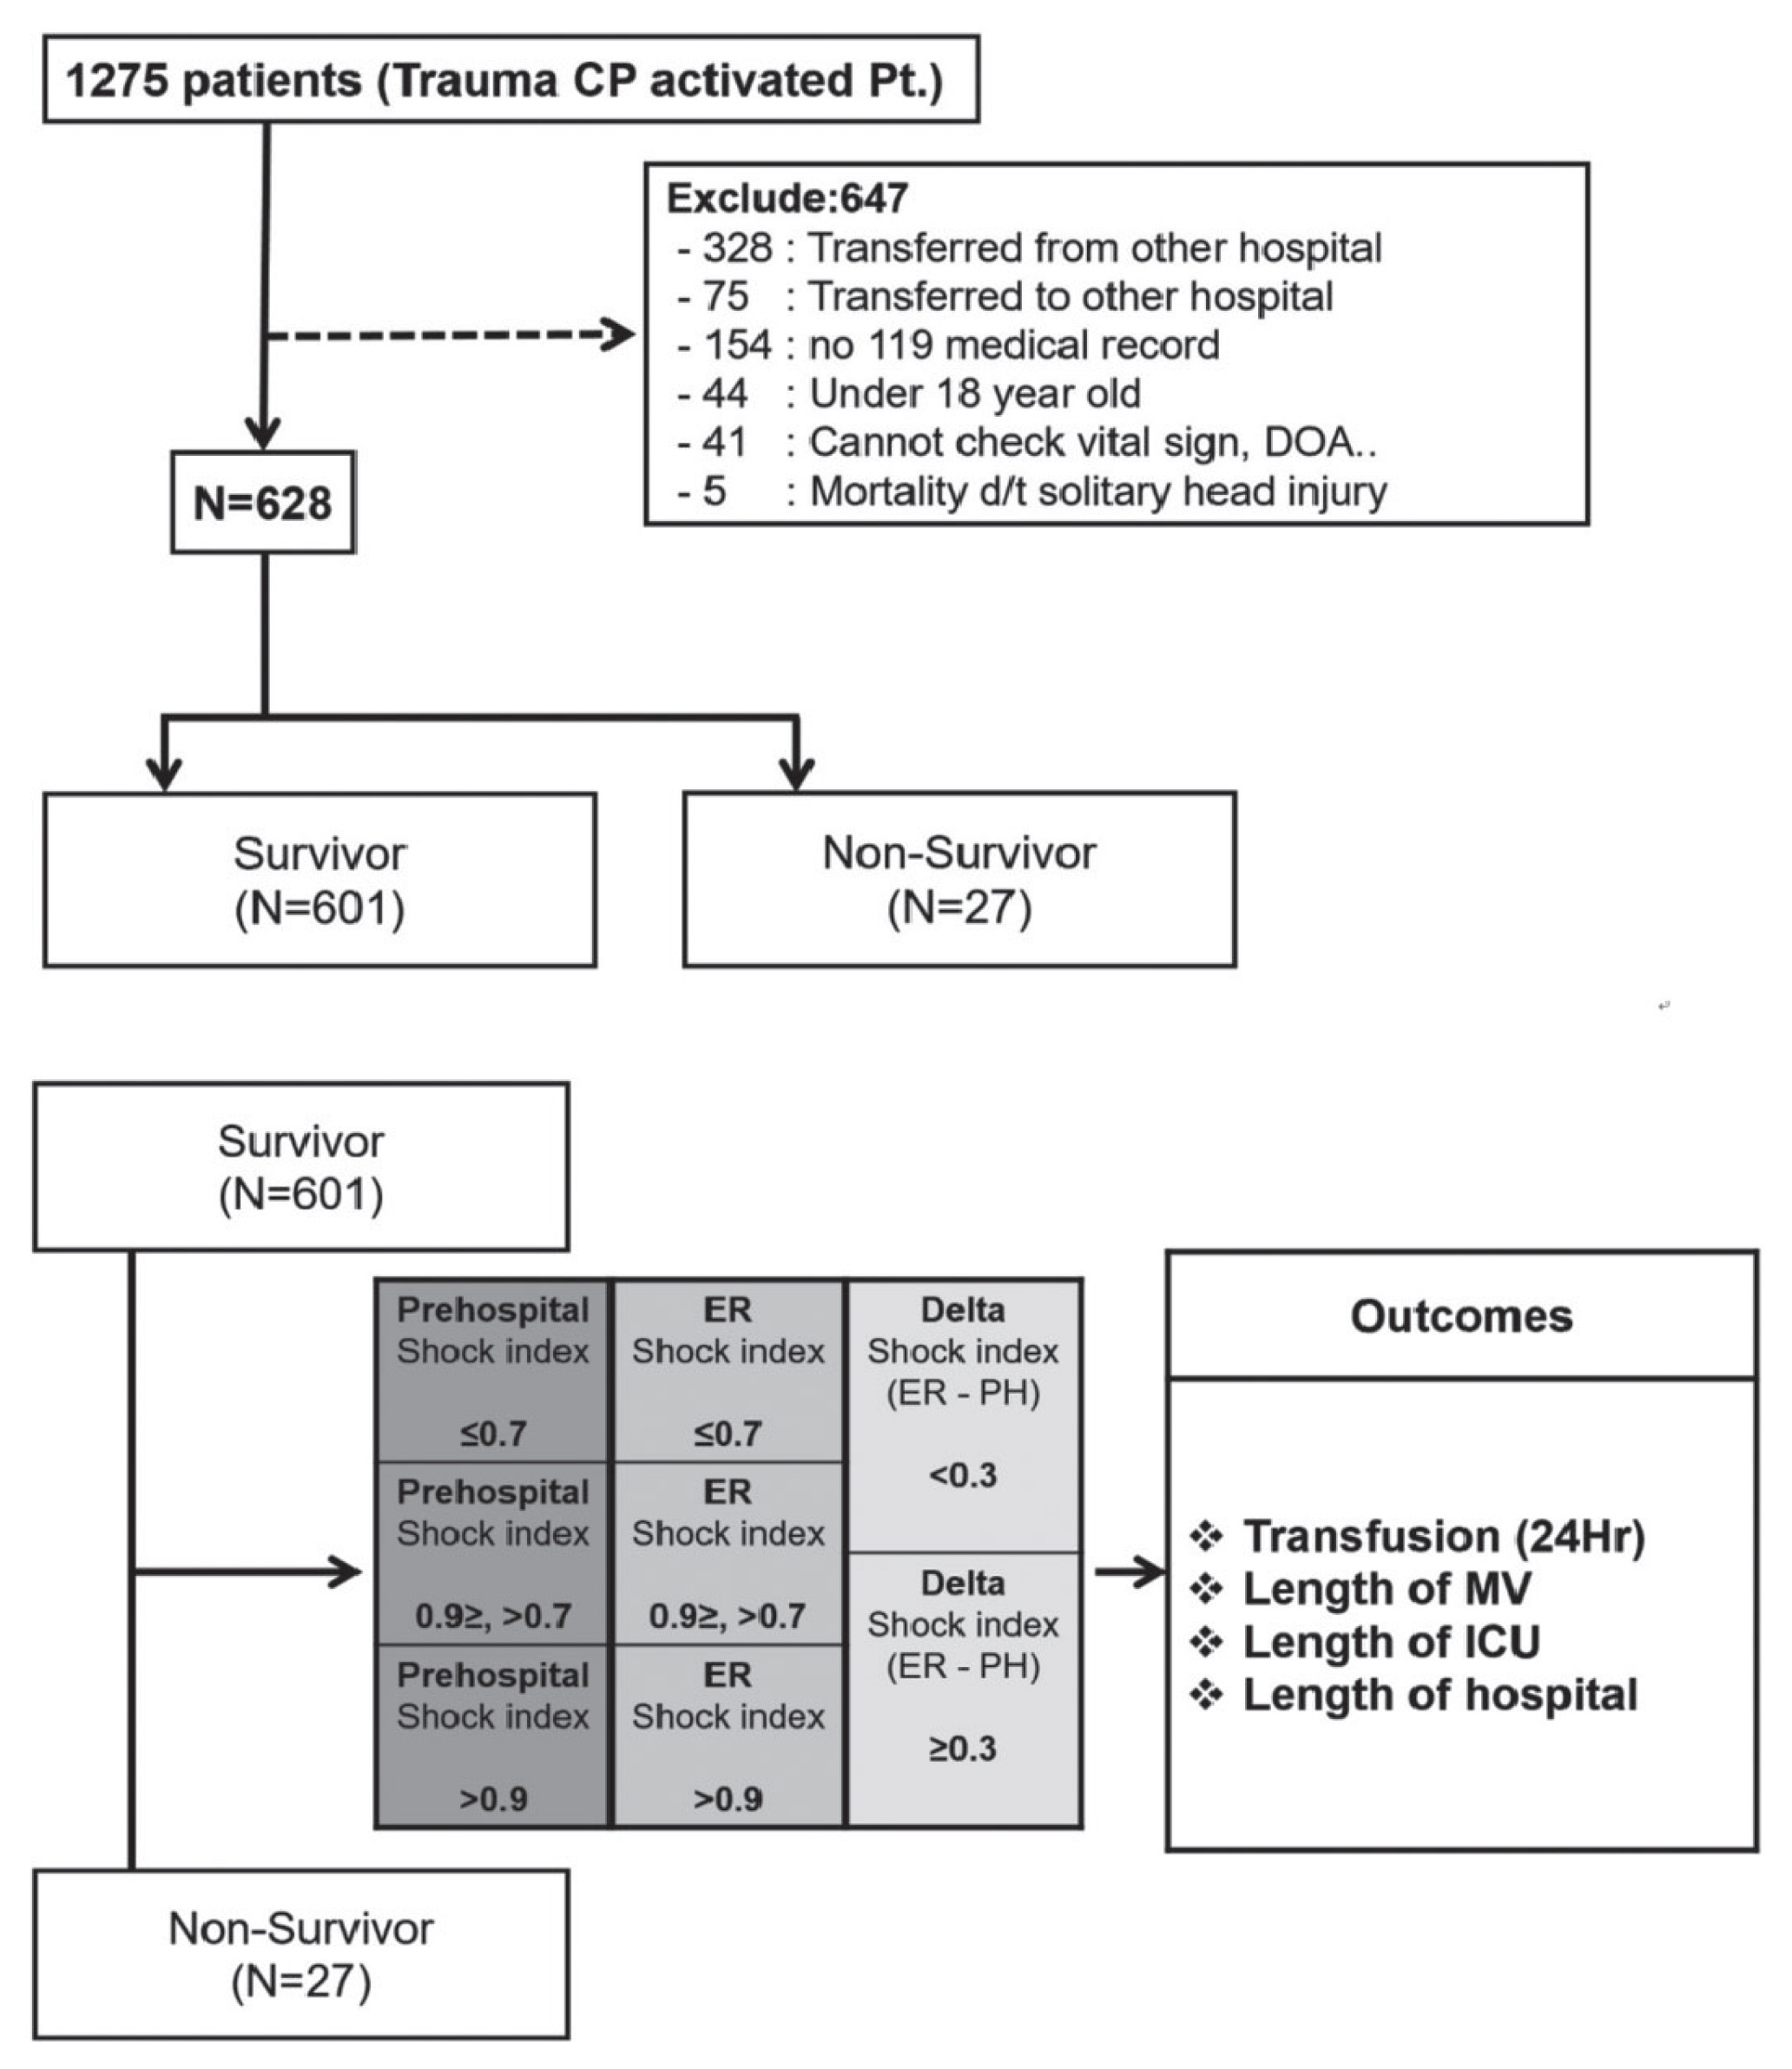
Flow diagram of patients selected for analysis. CP: critical pathway, Pt.: patient, DOA: death on arrival, d/t: due to, ER: emergency room, PH: pre-hospital, Hr: hour, MV: mechanical ventilation, ICU: intensive care unit.
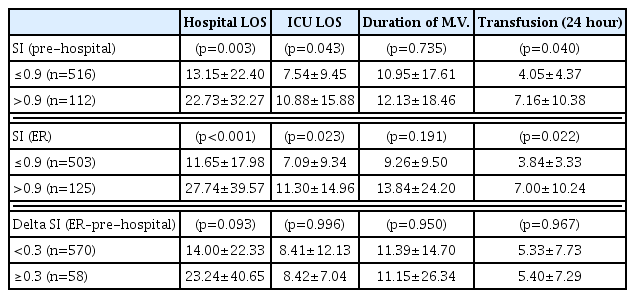
Then, we compared the differences in patients’ progress according to the prehospital, ER, and delta SIs. Patients were divided into three groups: group with prehospital SI <0.7, those with prehospital SI >0.7 but <0.9, and those with prehospital SI ≥0.9 [10]. Then, progressions of each group were compared. The progression variables investigated here are “hospital length of stay (LOS)”, “intensive care unit (ICU) LOS”, “transfusion amount within 24 hours”, and “duration of mechanical ventilation (MV).” Subsequently, patients were divided into three groups again according to ER SI the same way as the investigated variables mentioned above. Finally, the patients were divided into two groups based on delta SI 0.3 point, and differences in progression between the two groups were compared.
Clinical variables
Data collection included the following variables: sex, age, injury mechanism, vital signs at the prehospital scene and ER, abbreviated injury scale (AIS) score, injury severity score (ISS), revised trauma score (RTS), trauma and injury severity score (TRISS), arterial blood values (pH, PCO2, PO2, hemoglobin, base excess [BE]), and serum lactate level. We analyzed amount of transfusion within 24 hours, hospital LOS, ICU LOS, duration of MV, and mortality within 30 days.
The prehospital SI was calculated by dividing the patient’s HR by the SBP based on 119 medical records measured in the trauma scene. The ER SI was calculated by the same method as that in the prehospital SI based on the vital signs measured immediately after the ED visit. Finally, the delta SI was calculated as the “ER SI minus prehospital SI.”
Statistical analysis
Statistical analysis for investigated items was performed using SPSS® version 23.0 (IBM, Armonk, NY, USA). Categorical data were presented as numbers (%) and compared using the chi-square or Fisher’s exact tests. Continuous variables were expressed as mean±standard deviation or median and interquartile range, and the data were compared between groups using the Student t-test or Mann-Whitney U test. Factors found to be significantly associated with mortality on univariate analysis were included in multivariate analysis. Logistic regression modeling was performed using the maximum likelihood method and backward stepwise selection. Goodness of fit was assessed using the Hosmer-Lemeshow test. The odds ratios (ORs) were given with 95% confidence intervals (CIs). Kaplan-Meier survivor curves were generated using the mortality and hospital LOS to compare the survivor of each group, and the hazard of death was compared across the groups using the log-rank test. Pearson correlation coefficients were used to evaluate the relationship between SI and several outcome variables. A p-value<0.05 was considered statistically significant.
RESULTS
General characteristics
A total of 628 patients were included in this study. Among them, 453 were male and 175 were female. The mean ISS was 13.12, the mean RTS was 7.356, and the mean TRISS was 91.59. The median ICU LOS was 4 days, and the median hospital LOS was 7 days.
The baseline characteristics of patients are presented in Table 1. Of 628 patients, 27 patients died within 30 days, and 601 survived. Overall mortality was 4.49%. There was no significant difference in sex (p=0.076), but there was a significant difference in mortality according to age (p<0.001). There was a significant difference in mortality according to injury mechanism (p=0.016), and pedestrian traffic accident (51.9%) was the most common in the non-survivor group. The injured site was significantly associated with mortality with respect to the chest (p<0.001) and extremity (p=0.021). ISS (p<0.001), RTS (p<0.001), and TRISS (p<0.001) also showed significant differences between the two groups. BE (p<0.001), lactate (p<0.001), and pH (p<0.001) also showed significant differences between both groups. Prehospital (p=0.020), ER (p=0.002), and delta SIs (p<0.001) were all significantly higher in the non-survivor group.
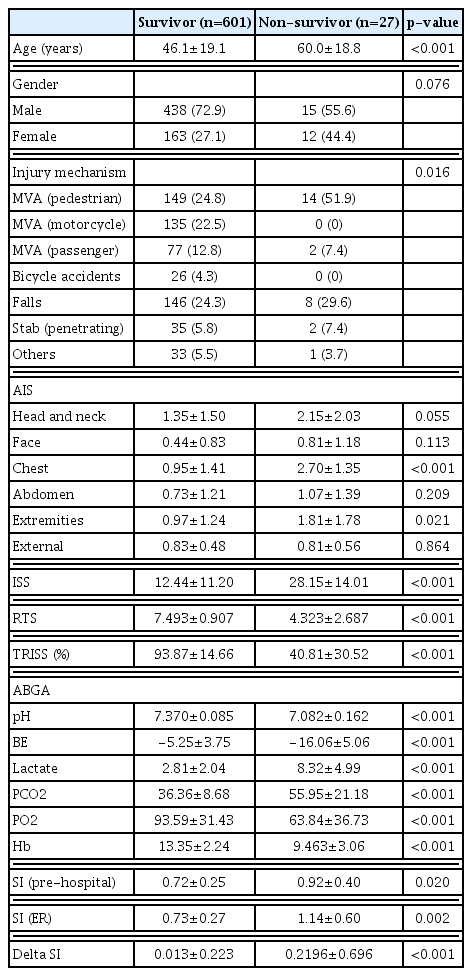
Baseline characteristics of patients
SI as a risk factor of inhospital mortality
Mortality rate in patients with trauma was significantly higher when “prehospital SI was >0.9 (p<0.001)”, “ER SI >0.9 (p<0.001)”, and “delta SI ≥0.3 (p<0.001)” (Table 2). Results of the univariate and multivariate regression analyses are shown in Table 3. Patient’s age (OR, 1.068; 95% CI, 1.038–1.099; p<0.001), “prehospital SI >0.9” (OR, 11.629; 95% CI, 4.195–32.235; p<0.001), and “delta SI ≥ 0.3” (OR, 12.869; 95% CI, 4.931–33.588; p<0.001) were identified as risk factors for trauma-related mortality. Kaplan-Meier curves showed significantly lower survival rate when prehospital SI was >0.9 (p<0.001), ER SI >0.9 (p<0.001), and delta SI ≥0.3 (p<0.001) (Fig. 2).
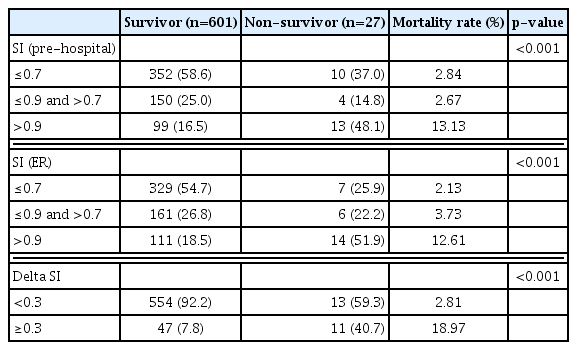
Mortality according to SI
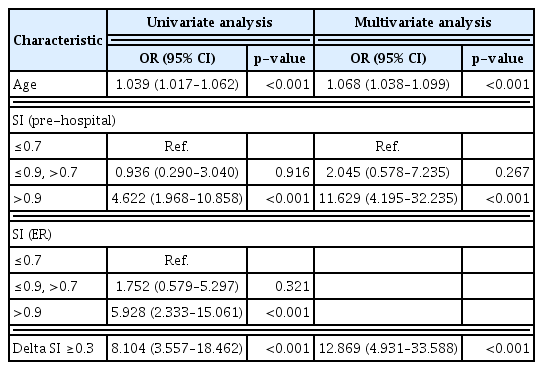
Risk factors of mortality in trauma patient

Kaplan-Meier survivor curve according to SI. SI: shock index, ER: emergency room.
SI and clinical progression
Pearson coefficient analysis reveals significant linear relationship between prehospital SI and hospital LOS, ICU LOS, and transfusion amount within 24 hours (Table 4). ER SI also shows significant linear relationship with these three variables. Duration of MV was not related to any kind of SI. Moreover, delta SI did not show any significant linear relationship with these clinical progression markers. Patients with “prehospital SI >0.9” and “ER SI >0.9” also showed significant difference in hospital LOS, ICU LOS, and transfusion amount in the analysis of Pearson chisquare test (Table 5).

Progression markers according to SI (Pearson coefficient analysis)
Progression markers according to SI (Pearson chi-square test)
DISCUSSION
Trauma is the number one cause of death in patients under 45 years of age. This is a common phenomenon in not only Korea but also the United States and the world [11–13]. Mortality rate reduction and improvement of outcomes depend on how quickly we detect and control bleeding in patients with trauma [14].
SBP and HR are sensitive indicators of bleeding or shock and can be easily measured in any situation. However, because of early physiologic compensation or pain in patients with trauma, it is difficult to determine the relationship between changes in these vital signs and actual bleeding [3,4,7]. Lactate and BE are also good indicators of patient’s shock status; however, it takes about an hour to obtain results after arrival at the hospital [15,16]. Scoring system, such as ISS and TRISS, was also found to be highly correlated with the prognosis of patients with trauma; however, early diagnosis is limited because these scores are the final results after all workups have been completed [16,17]. An image study, such as computed tomography (CT), can show definite bleeding. However, CT is often difficult to perform depending on the patient’s condition, and the advanced trauma life support guideline recommends not to perform CT at the primary surveillance stage [18].
The usefulness of SI was highlighted in the diagnosis of hemorrhage in patients with polytrauma for these reasons. Our study shows that SI is also useful in predicting clinical progress in patients with polytrauma.
SI was a good predictor of mortality in patients with polytrauma based on the results of our study. Especially, “delta SI” was identified as the most powerful predictor of trauma-related mortality. There were 58 (19%) patients who had a delta SI of ≥0.3, and their mortality rate was 18.97% in this study, which showed a significant difference from the group of patients with delta SI <0.3 (2.81%). Delta SI reflects the change in severity of trauma, and an increase in delta SI indicates hypovolemic shock, ongoing bleeding, and insufficient resuscitation during transfer [11,19]. Delta SI can be calculated only with vital signs monitoring without additional equipment, which is advantageous in the clinical decision in patients with acute stage trauma.
Patients who are elderly, taking β-blockers, or pregnant do not follow the usual physiology of bleeding and have different vital sign changes in a trauma situation. Because delta SI is calculated by differences measured at two points, its sensitivity is higher than that in the single cross-sectional SI when we evaluate patients with confusing factors. Moreover, patients with these confusing factors are generally at higher risk for mortality when trauma occurs. Therefore, delta SI is also useful in the survival of patients with high-risk trauma [19–21]. Moreover, delta SI has advantages of objective severity determination, triage, and sharing of patient severity information between the trauma scene and ED [7,22]. Thus, delta SI can play a role in predicting mortality and clinical decision-making in the early acute stage in patients with trauma-related hypovolemic shock.
However, delta SI did not show any significant difference in hospital LOS, ICU LOS, amount of transfusion, or duration of MV. We believe this is related to the trimodal peak of the mortality graph in patients with trauma. The second peak is death at the ED stage; a high delta SI is associated with second-stage mortality [23]. Therefore, delta SI is associated with acute stage outcome such as ED mortality rather than the long-term in-hospital progress.
However, SI at a single time point was significantly related to hospital LOS, ICU LOS, and transfusion amount. The higher the SI, the greater the difference in these outcomes of the patient: not only according to the ER SI but also along the prehospital SI. Unlike previous studies, this is meaningful in showing a significant correlation between prehospital SI and patient progress [14,21]. This result will help properly distribute the medical resources such as hemorrhagic control modality and blood transfusion to patients who most need them, among the patients with trauma transferred to the hospital [24]. Prospective study would be needed to determine the relationship between SI and various progression markers.
This is a retrospective study and has some limitations in the study of a single institution. In addition, the relatively small sample size and regional difference in trauma mechanism have to be considered as limitations of our results. Patients with trauma may have a different prognosis depending on the anatomical location of the bleeding, but in this study, this was not considered. Moreover, we did not investigate the use of β-blockers, which can affect the vital signs. Furthermore, when calculating the delta SI in this study, the time difference when patient was transferred from the trauma scene to the ED was not considered. Thus, further study is needed to investigate how SI correlates with patient outcomes when the time variable is included.
However, our study is meaningful in that it was intended to show the difference in prognosis according to the different time points (prehospital and ER) of SI and change in SI (delta SI). This is a distinctive strength from the previous studies that attempt to correlate the outcome with a single measurement point of the SI. The results of this study on SI can help to predict the prognosis of patients with trauma earlier and provide treatment appropriately.
CONCLUSION
Prehospital, ER, and, especially, delta SIs can play a role as predictors of mortality in patients with trauma. Therefore, more active evaluation and management will be needed in patients with high SI.
Moreover, both prehospital and ER SIs can reflect the patient’s hospital LOS, ICU LOS, and transfusion requirement. Thus, SI can be used to estimate the prognosis and provide appropriate treatment for each patient.
ACKNOWLEDGEMENTS
This study was supported by a faculty research grant of Yonsei University College of Medicine (6-2016-0100).